When going backpacking, what choices should you make that will reduce your environmental impact? Furthermore, how should this impact the gear you decide to use?
I’ve seen this question raised numerous times in the ultralight community. People seem interested in reducing their environmental impact for backpacking. This especially comes up for folks that are vegan, as many times the choice to be vegan is partially, or entirely, motivated by reducing environmental impacts.
I’ve responded to this question briefly on the ultralight subreddit here and here, but thought it was worth making a larger post on this topic, and doing some more robust analysis with better documentation of emission values found in the literature.
Summary
These estimates for the environmental impacts of backpacking come largely from my own gear choices and the style of backpacking that I enjoy (thru-hiking and long trails). To make my results more generalizable, I have assessed impacts in terms of miles spent backpacking:
- Backpacking Gear: 36 gCO2e/mile
- Food (additional calorie needs): 97 gCO2e/mile (vegetarian diet)
- Transportation to/from hiking: 3300 gCO2e/mile
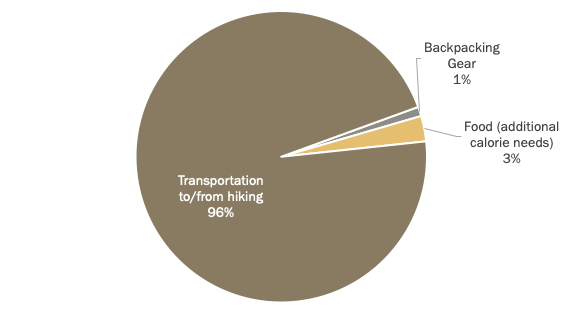
The largest environmental impact of backpacking comes from traveling to backpacking locations. The best way to minimize this impact is to:
- Use modes of transport that are more efficient, like public transportation or hitchhiking
- Drive as many people in your vehicle as possible when you travel
- Increase the length of your backpacking trips
For instance, when I hiked the Pacific Crest Trail I was able to take Amtrak from Canada back to my home in California. This substantially reduced the emissions associated with traveling back from the trailhead. The PCT is around 2700 miles in length, and it took me 96 days to hike. The decision to take Amtrak as well as the duration of the hike brought my travel emissions down to a ballpark of 500 to 1000 gCO2e/mile compared to my “normal” backpacking trips that likely have emissions closer to 3000 gCO2e/mile. The environmental impacts of travel needed to go hiking are likely to be in far excess of any other environmental impacts associated with backpacking.
My Philosophy on Environmental Impacts
With every environmental issue, you need to look at counterfactuals and comparisons. There is unlikely to be an absolute best answer that tells you precisely what to do. When it comes to personal choice (especially for environmental issues) there will be personal values that influence your decisions.
For most environmental issues, however, you can often break down impacts into “local” environmental impacts and “global” environmental impacts. Local impacts are things that are likely to impact people and ecosystems close to where production and use occurs, while global impacts are likely to impact everyone.
Local Emission Considerations
I personally am of the belief that local environmental impacts are best addressed through the development and implementation of local environmental policy, and not through demand-side boycotts or minor shifts in purchasing behavior. As such, I tend to evaluate my environmental choices based on global impacts.
As an example, releasing effluent from a polyethylene production facility into a lake may be illegal within a country. It is up to that country to largely enforce their policies and to make them more stringent due to negative consequences that impact the people and ecosystems in these communities. Ecosystems and communities that are far away from the production facility, however, would be unlikely to experience environmental impacts due to the effluent discharge.
Global Emission Considerations
When it comes to global environmental issues we often have large, distributed impacts that end up accumulating (e.g. global warming). As we’ve seen, it’s very hard to enact local policies that address global environmental issues, which is why consumer demand and considerations should be a large priority. Things like border-adjusted carbon taxes, or consumption-based taxes enacted in local municipalities should really have far more popularity than they do, but I digress.
Establishing Backpacking Environmental Impacts
Environmental Impact of Backpacking Gear
To better understand the environmental impacts of backpacking, I first had to come up with a rough greenhouse gas emission inventory. First, I loaded up my lighterpack list and downloaded it as a CSV. I went through all items on my list, and sorted them into categories based on their primary material specification. I then went to the academic literature and found estimates to give me the ballpark Global Warming Potential (GWP) for each product category.
It’s important to note that Goose Down was impossible to find information on. In a terrific article I found, it was mentioned that Goose Down is super environmental because it only makes up 5% of the total economic value of goose-farm operations. The article also suggests that “down has the lowest carbon footprint of any fill material,” but it has a large variety of other ethical considerations.
For a typical Life-Cycle Assessment (LCA) approach, it is reasonable to do economic attribution of impacts. As such, I used a paper about the LCA of foie gras production to establish an emissions estimate and took 5% of that value.
From a quick review of the literature, I developed this table (feel free to use it for your own estimates):
Table 1. Global Warming Potential for a variety of materials used in outdoor apparral
| Material | Emissions (kg CO2e/kg) | Reference |
| Aluminum | 22 | YANG, Y., GUO, Y., ZHU, W., & HUANG, J. (2019). Environmental impact assessment of China’s primary aluminum based on life cycle assessment. Transactions of Nonferrous Metals Society of China, 29(8), 1784–1792. doi:10.1016/s1003-6326(19)65086-7 |
| Food | See Below | Complicated – more discussion later |
| Lithium-Ion Battery | 19 | Ellingsen, Linda Ager‐Wick, et al. “Life cycle assessment of a lithium‐ion battery vehicle pack.” Journal of Industrial Ecology 18.1 (2014): 113-124. |
| Natural – Cotton | 23 | van der Velden, Natascha M., Martin K. Patel, and Joost G. Vogtländer. “LCA benchmarking study on textiles made of cotton, polyester, nylon, acryl, or elastane.” The International Journal of Life Cycle Assessment 19.2 (2014): 331-356. |
| Natural – Possum? | NA | Could not find anything, so just ignored it |
| Natural – Wool | 32 | Henry, Beverley. “Understanding the environmental impacts of wool: A review of life cycle assessment studies.” International Wool Textile Organisation, Brussels (2012). |
| Smartphone | 79 | Ercan, Mine, et al. “Life cycle assessment of a smartphone.” ICT for Sustainability 2016. Atlantis Press, 2016. |
| Synthetic – Carbon fiber | 20 | Gibson, T. L. (2000). Life Cycle Assessment of Advanced Materials for Automotive Applications. SAE Technical Paper Series. doi:10.4271/2000-01-1486 |
| Synthetic – Nylon | 10 | van der Velden, Natascha M., Martin K. Patel, and Joost G. Vogtländer. “LCA benchmarking study on textiles made of cotton, polyester, nylon, acryl, or elastane.” The International Journal of Life Cycle Assessment 19.2 (2014): 331-356. |
| Natural – Down | 1.875 | Arroyo, Julien, et al. “Environmental influence of maize substitution by sorghum and diet presentation on goose foie gras production.” Journal of cleaner production 59 (2013): 51-62. |
| Synthetic – Polyethylene | 4.8 | van der Velden, Natascha M., Martin K. Patel, and Joost G. Vogtländer. “LCA benchmarking study on textiles made of cotton, polyester, nylon, acryl, or elastane.” The International Journal of Life Cycle Assessment 19.2 (2014): 331-356. |
| Synthetic – Polyurethane | 5 | Gottfridsson, Marie, and Yuqing Zhang. Environmental impacts of shoe consumption, Combining product flow analysis with an LCA model for Sweden. MS thesis. 2015. |
| Synthetic – Polyvinylidene fluoride resin | 23 | Gibson, T. L. (2000). Life Cycle Assessment of Advanced Materials for Automotive Applications. SAE Technical Paper Series. doi:10.4271/2000-01-1486 |
| Synthetic – Shoes | 17 | Cheah, Lynette, et al. “Manufacturing-focused emissions reductions in footwear production.” Journal of cleaner production 44 (2013): 18-29. |
| Titanium | 52 | Gibson, T. L. (2000). Life Cycle Assessment of Advanced Materials for Automotive Applications. SAE Technical Paper Series. doi:10.4271/2000-01-1486 |
| Leather | 26 | Gottfridsson, Marie, and Yuqing Zhang. Environmental impacts of shoe consumption, Combining product flow analysis with an LCA model for Sweden. MS thesis. 2015. |
Using this table, I evaluated all of my gear based on the expected lifetime for each item. My gear list and expected gear lifetimes can be found here. Adding up these emission characteristics, I ended up with an approximate estimate of 36 gCO2e per mile hiked
Environmental Impact of Backpacking Food
To look at the impacts affiliated with food consumption, I used two articles that looked at GWP affiliated with European diets. One paper characterized emissions associated with an average diet in the UK. The other paper consisted of a meta analysis that primarily compared shifts to European diets. I used these values to assess how a vegan and vegetarian diet may compare to an average UK diet.
As people need to eat food regardless of whether or not they’re backpacking, I decided to only attribute emissions to backpacking that are affiliated with the additional food needed to maintain body weight (the caloric burn). From my extensive backpacking experiences, I have found that I need to consume a minimum of 4000 calories per day to not lose weight when I’m traveling around 28 to 32 miles per day. My usual daily diet is around 1800 to 2200 calories per day. For reference, I’m 5’6” and 130 lbs. As such, I attributed backpacking to creating a new 2000 calorie requirement per 30 miles of travel, or approximately 67 calories per mile hiked. The table below shows how different diets would impact emissions.
I am vegetarian, so my estimate is around 97 gCO2e/mile hiked
Table 2. Estimated GWP for additional caloric intake needed per mile spent backpacking
| Diet | Emissions (kg CO2e/calorie) | gCO2e per Mile |
| Vegan | 1.15E-03 | 76 |
| Vegetarian | 1.46E-03 | 97 |
| Default (UK) | 2.09E-03 | 139 |
Establishing Transportation Impact for Backpacking
This one is fairly easy, and is what I spend a lot of my time doing professionally. In general, I aim to spend 3 times as much time hiking as I spend driving to and from a trail head. While I try to make this a reality, I have found that over the years this tends to average out to being closer to 2 times as much time hiking as I spend traveling.
Looking at a 30-mile backpacking trip, my standard hiking pace is around 3 miles per hour. This means that I’ll spend approximately 10 hours of hiking. This might translate into a weekend warrior trip that looks like this:
Friday – Drive 2.5 hours after work to a trailhead, hike 2 miles in and setup camp
Saturday – Hike 18 miles, camp
Sunday – Hike 8 miles out, drive 2.5 hours home
The car I use typically gets around 32 miles per gallon. California gasoline has energy content of 115.83 MJ per gallon, and emissions of around 100 gCO2e per MJ (ref). Assuming I average about 55 miles per hour, that translates to about 275 miles of driving, with emissions of 100 kg for the trip. Or, about 3300 grams per mile hiked.
What Can I do to Reduce My Environmental Impacts?
The biggest impact for backpacking is traveling to a trailhead. If you add one more person to a solo trip, you effectively halve your impact – this will have a much larger change on your impact compared to anything else you can probably do.
Switching over to a different mode of transport, like a bus or a train, is also going to substantially reduce your impact. This is the low-hanging fruit from a global environmental perspective.
Next up is your food choices. Simply switching from a conventional diet to a vegetarian diet for your additional calories is likely to save 42 gCO2e per mile traveled. This is a larger impact than the collective impact that your gear is likely to have. If you change all of your food over to a vegetarian diet from a conventional diet, you would double the impact to 84 gCO2e per mile traveled. This is based on my case, where I consume 4000 calories per day backpacking compared to 2000 calories per day not backpacking.
Going to a vegan diet shaves off an additional 21 gCO2e per mile (additive calories) and 44 gCO2e per mile (all calories) respectively. Again, being fully vegan while backpacking would effectively offset your gear decisions.
Gear Considerations for Backpacking
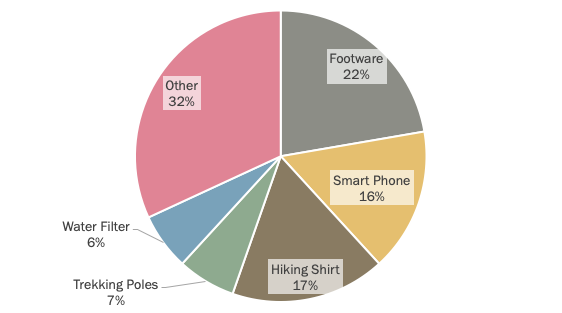
As the question in the UL community is often around gear, and whether or not it makes more sense to use wool or synthetics, or leather boots vs synthetic boots, I think it’s worth looking at “hot spot” analysis, and figuring out what “alternative” products look like for the largest gear hotspots. From my analysis, here are the top 5 biggest gear impacts for my gear:
| Gear Item | gCO2e/mi | Type |
| Trail Runners | 8.03 | Synthetic |
| Smart Phone | 5.74 | Synthetic |
| Hiking Shirt | 6.18 | Wool |
| Trekking Poles | 2.33 | Carbon Fiber |
| Water Filter | 2.27 | Synthetic |
The smartphone is an interesting impact category. One would argue that it’s not fair to attribute smartphone emissions to hiking. However, in my personal experience, I have found that hiking with a smartphone does, in fact, degrade its useful lifetime. Some of my friends have lost their phones down glaciers, or off cliffs. I’ve personally had my smartphone die from being exposed to rain while trying to navigate in a storm. One of my phones died from overheating when it was stored in a dry bag on a kayaking trip. In the LCA document I used for smartphones, they assumed the average lifetime of a smartphone was 3 years. I assumed that a thru-hike, like the PCT, is likely to make the phone die 25% faster. I assumed the PCT equates to 2500 miles for smart phone use to get my estimate of 5.75 gCO2e per mile spent backpacking.
From this hotspot analysis, it doesn’t look like anything can be done about the Smart Phone or the Water Filter. I think it’s also worth considering impacts affiliated with a down vs synthetic sleeping bag. I created a breakdown to compare what this might look like for possible product substitutions. The breakdown shows estimates for making major changes to a number of products that are frequently discussed.
Substituting Gear
The major thing that jumps out to me is that your biggest environmental impact you can have in terms of gear is choosing wool products compared to synthetic alternatives. The lifetime of the product largely influences this result. For wool shirts, I’ve personally had numerous shirts degrade on me after 500 to 1000 miles of use. Polyester shirts have not degraded in this way. Everything else results in fairly marginal improvements to your overall hiking system.

One other interesting result is down vs synthetic sleeping bags, in which the down bag has substantially lower emissions relative to the synthetic bag. This again is influenced greatly by assumptions about the lifetime of the product. Additionally, my estimate on emissions affiliated with down production is based on questionable sources, so I wouldn’t spend too much time thinking about the environmental impact of this specific gear choice.
Shoes
Synthetic Shoe: 8 gCO2e/mile
Leather Shoe: 8.7 gCO2e/mile
Major assumption: Leather shoe lasts 1500 miles vs 600 miles, but are 25% heavier
Hiking Shirt
Wool Shirt: 6.2 gCO2e/mile
Polyester Shirt: 1 gCO2e/mile
Major assumption: Synthetic Shirt lasts 2500 miles, rather than only 1000 miles
Trekking Poles
Carbon Fiber: 2.3 gCO2e/mile
Aluminum: 1.9 gCO2e/mile
Major assumption: Aluminum poles last 5000 miles rather than 3000 miles
Sleeping Bag
Down Bag: 0.14 gCO2e/mile
Synthetic Bag: 0.4 gCO2e/mile
Major assumption: A synthetic bag has substantially degraded after 10,000 miles compared to 15,000 miles for a down bag