Since my 2018 thru-hike of the PCT, I’ve always been wondering what travel along the trail corridor looks like. I’ve finally had some time to really dig into some hiker data to better estimate and understand this question. This is a pretty long, very wonky post that makes use of hiker data to answer a few key questions, namely:
- Where is the bubble and how does it move
- How many hikers skip and flip around trail
- How many people injure off trail or disappear from the trail, and
- how many hikers are actually hiking the CDT these days?
If you don’t want to get into the weeds, the companion tool can be found here that visualized the bubble nicely Where Is the Thru-Hiking Bubble? Additionally, the companion tool helps you estimate how many people are ahead of you or behind you on the trail.
- The Data
- Ways to Estimate and model the bubble
- Comparing the bubble estimation models
- How does snowpack move the bubble?
- Estimating the flippers and skippers
- Zeroes, long pauses, and people who disappear from trail
- Estimating the number of CDT Hikers
- Visualizing the bubble in a little tool
- Additional Diagnostics and Discussion
The Data
I utilize hiker comment data for the Pacific Crest Trail and the Continental Divide Trail. The data consists of comments at waypoints along the trail, covering several years of hiker comments, consisting of tens of thousands of observations. Importantly, each hiker comment has a mile on the trail affiliated with it, a time stamp the comment was made, and a unique hiker identifier. These three things can be used to estimate all sorts of cool things about the trail!
Let’s start with some visualization for a general sense of the data set. The PCT comment heat map, for all years, is below:
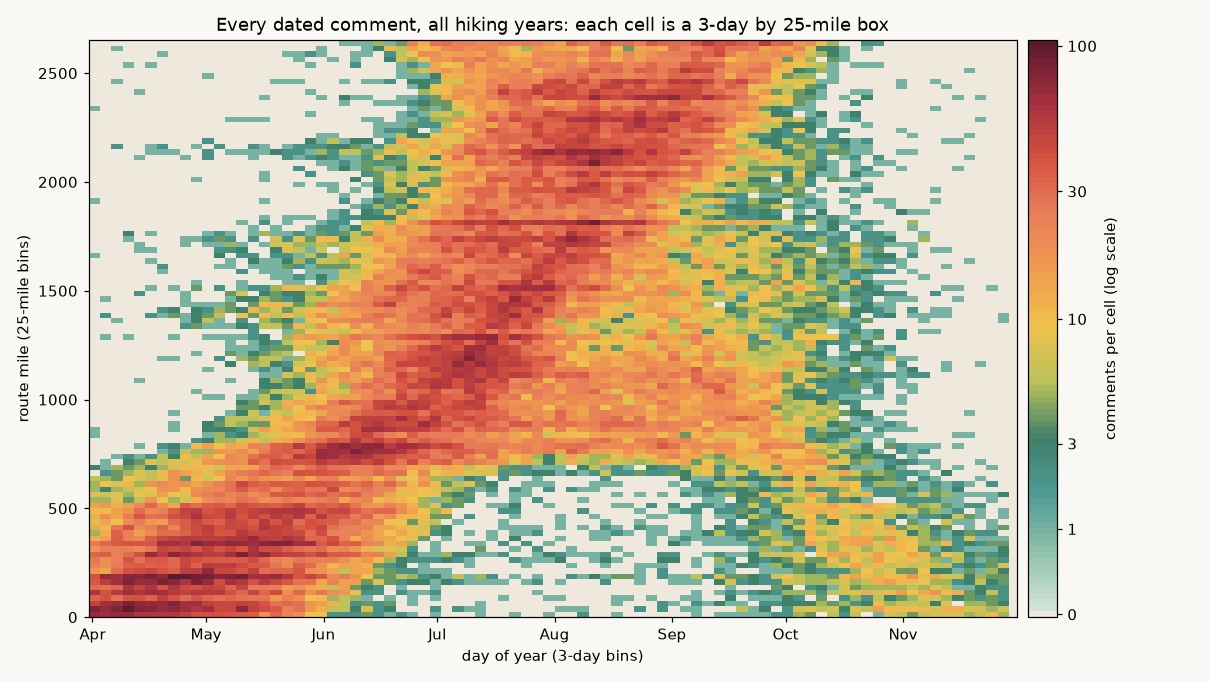
The x-axis is the day of the year (numerically starting at 0, and counting up to 365). The y-axis is the trail mile. Toward the top is the end of the trail (if going North Bound), and toward the bottom is the start of the trail. Each cell is a 3-day by 25-mile box (there’s some aggregation). The colors give an indication for how many comments are received within each gridded parameter. This is on a log scale, so a cell that is twice as dark has significantly more comments — check the legend bar. Cream cells have no comments.
Let’s take a look at the CDT:
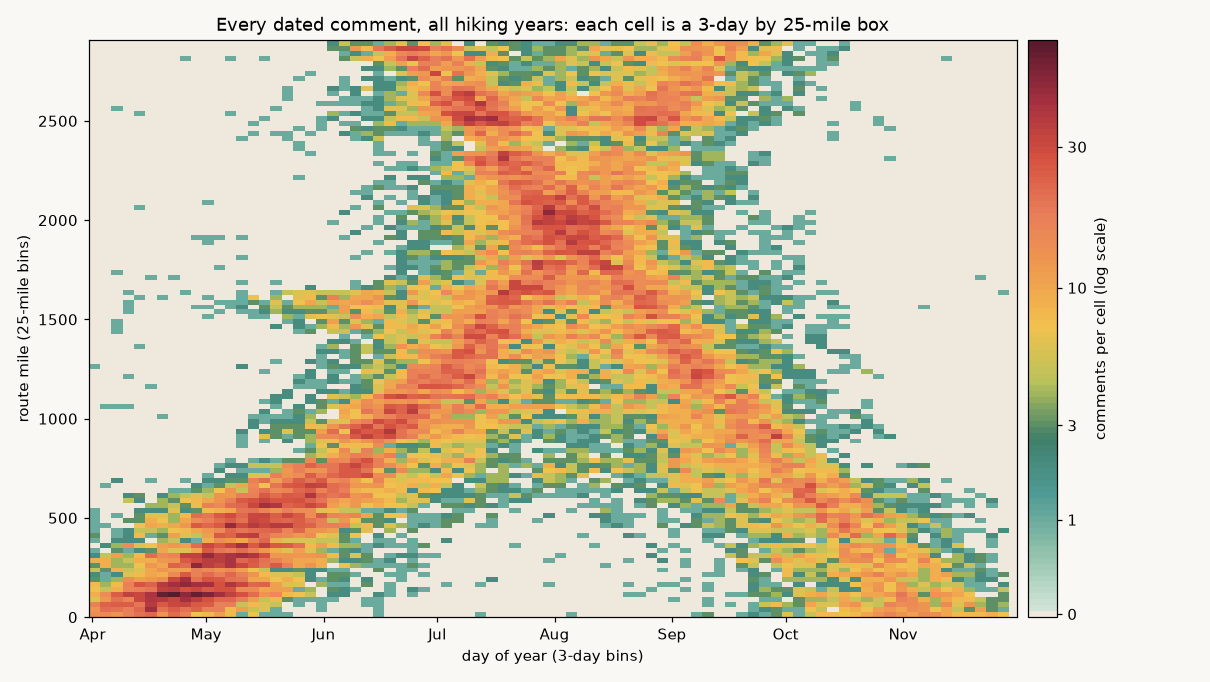
Unlike the PCT, the CDT has a *much* cleaner separation of comments for SOBOs and NOBOs. You can very clearly see the X pattern emerge from all comments.
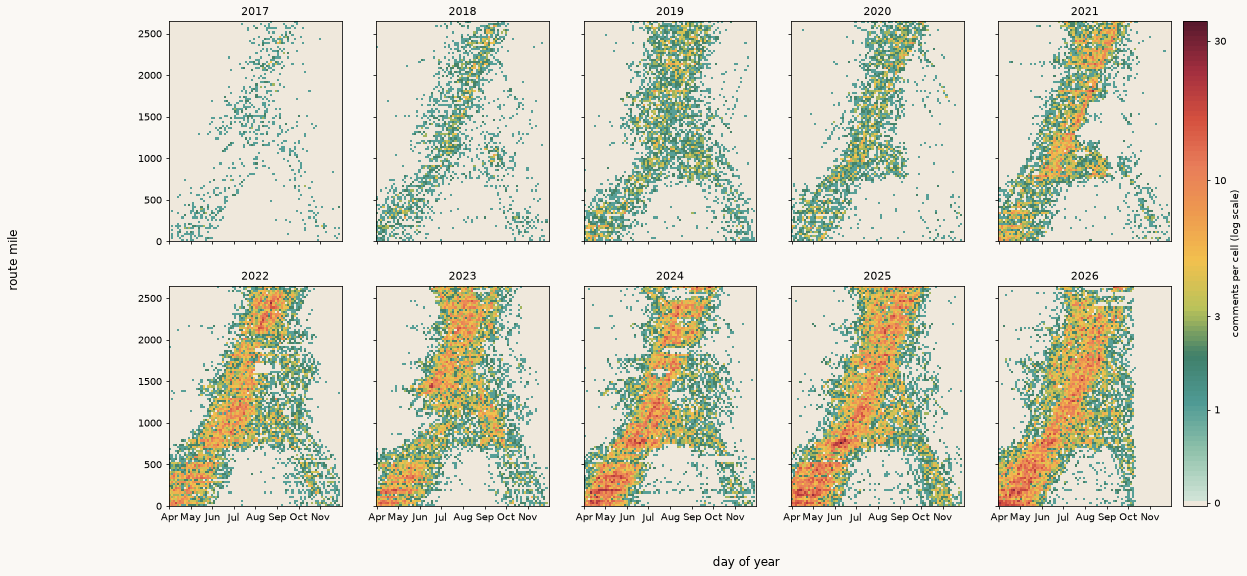
Separating the PCT into each hiking year, you can see some very interesting things! For instance, the SOBO bubble is barely detectable in 2020 (COVID). As more SOBOs have started on the PCT in recent years, you see a more defined tail end of the sobos. Unlike the clean X pattern of the CDT, however, the PCT Looks more like an upside down Y. As we’ll get into, this is because of flip floppers and section skippers that tend to muddy the waters and confound commenting and overlapping during periods that might otherwise show a fairly clean SOBO bubble.
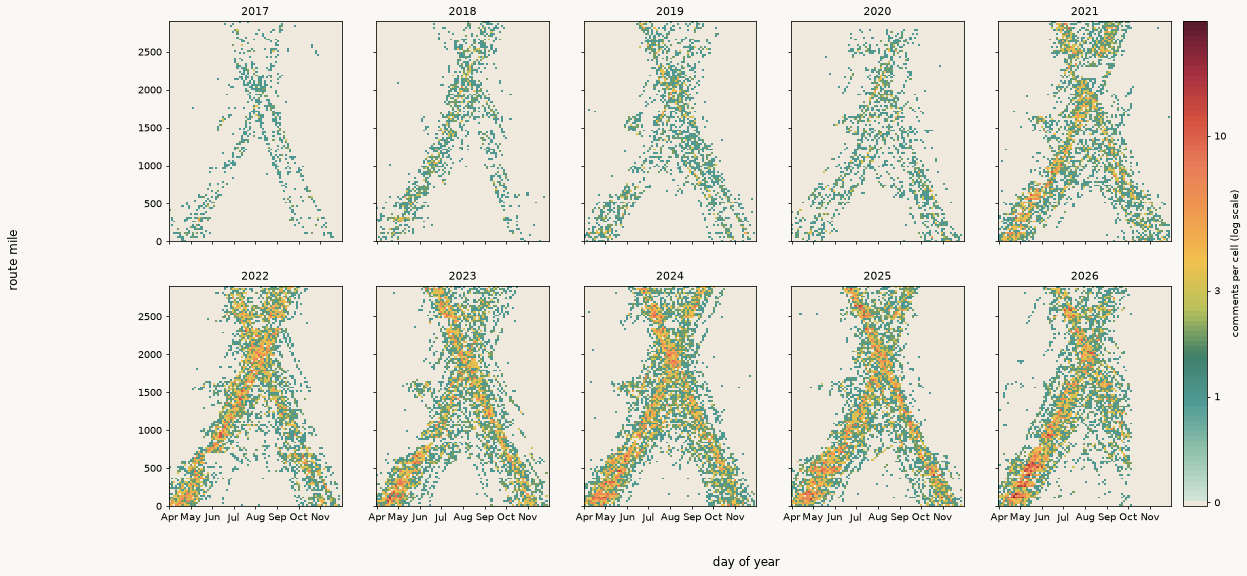
Again with the CDT, the clean X pattern for the NOBO and SOBO bubbles are apparent. The CDT has become much more popular in recent years, as can also be seen in the data.
Also worth noting, in the heavy-snow PCT years (2019 and 2023 are good examples), the northbound band gets wide and smeared through the Sierra and farther north. You can see the sudden pocket of comments deviating from the “heat band” in early-to-mid June. This is less visible in 2026 and 2018 — low snow years.
Ways to Estimate and model the bubble
“The bubble” is the crowd of hikers. If you’ve hiked these trails — you know it. Sometimes you want to be IN the bubble, where the excitement and action is with all your fellow hikers. Other times you want to avoid it. The local businesses along the corridors know when the bubble hits! It’s the difference between a couple pieces of hiker trash littered about a gas station versus 50+ a day.
Most of the discussion on bubble identification is based on identifying the location and date for the median northbound hike . The two main methods to identify the median hiker are discussed below.
Method A: how fast are people moving? If you find how fast people actually walk in each stretch, and then add up the number of days each person has been on trail, you’ll see a really good distribution for where you might expect hikers to be. Slower hikers will be less far up trail, and faster hikers will be further up trail. If the median hiker is at the start on day T0, they reach mile m on a specific day.
T(m) = T0 + ∫ from 0 to m dx / v(x) v(x) = speed of hiking (miles per day the day someone walks, at mile x)
To estimate hiking speed, v(x), I look at comment pairs. These are comments made by the same person on consecutive days. The miles between them is considered to be one day of walking. Comment pairs that occur under 3 miles apart are considered to be zero days and are excluded from the pace analysis. The rest of the comment pairs are fit to a gamma curve that accounts for that cutoff (throwing out zeros does not make people look faster). See additional discussion below.
Method B: estimating the median from comment density. This is more intuitive, as it looks like the trail heat maps above. You can cut the trail into sections. For each section (I divided the trail up into 10-mile sections), I looked at 75 miles before and after each mile-post to create a 150 mile stretch from which I pooled comments. I then took the dates of the comments written there by people who “look” northbound, and estimated the median date for all comments from NOBOs in that section. If you look at the comment median for each section as you move up the length of the trail, for every hiking year, you get a pretty good representation for how the bubble (the median) moves across each section of trail.
T(m) = median of { comment dates within ±75 miles of m } (northbound-looking comments only)
This assumes nothing about speed. It does assume that the comments on a stretch are a fair sample of the people who passed it.
There are limitations to either of these modeling methods, but if both tell a pretty similar story (the statistical results are robust), you can have more confidence in the outcome. The method I used for estimating median paces will fail to detect those that are taking shortcuts, or those that get delayed for some reason. It only measures those typically walking. On the other hand, the comment median looks at everyone commenting at a given section of trail, including the people who skipped ahead.
How far do people typically walk in a day? (Method A)
For each “main” section of trail I look at every comment written by the same person on consecutive days. The orange line is the median. Because these are pretty large sections (e.g. all of New Mexico), the number of comment pairs in the distribution is a reliable statistical sample.
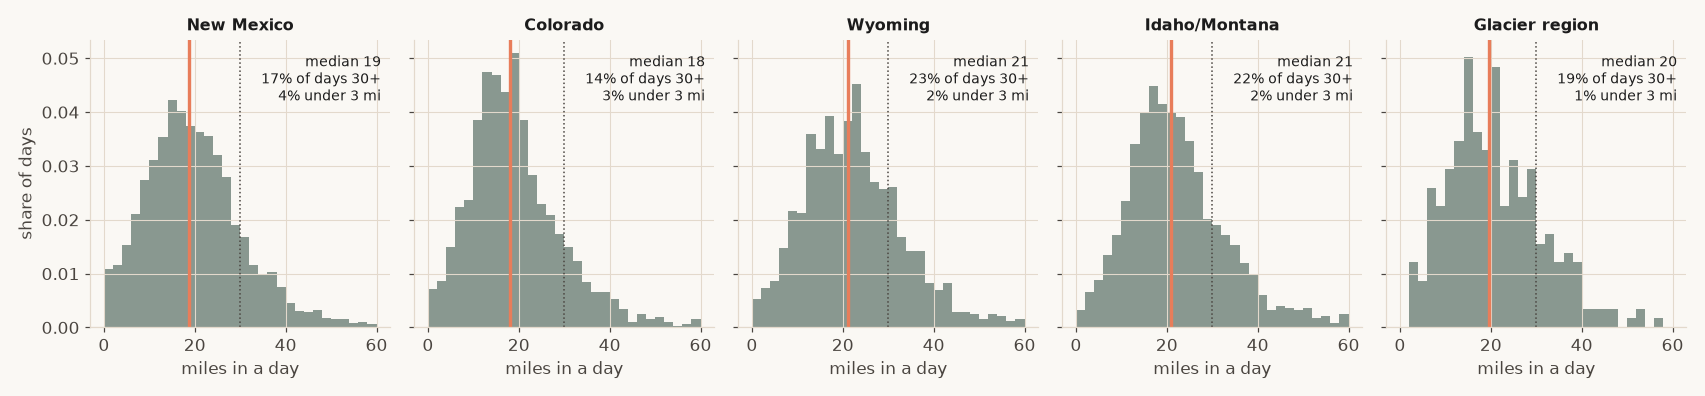
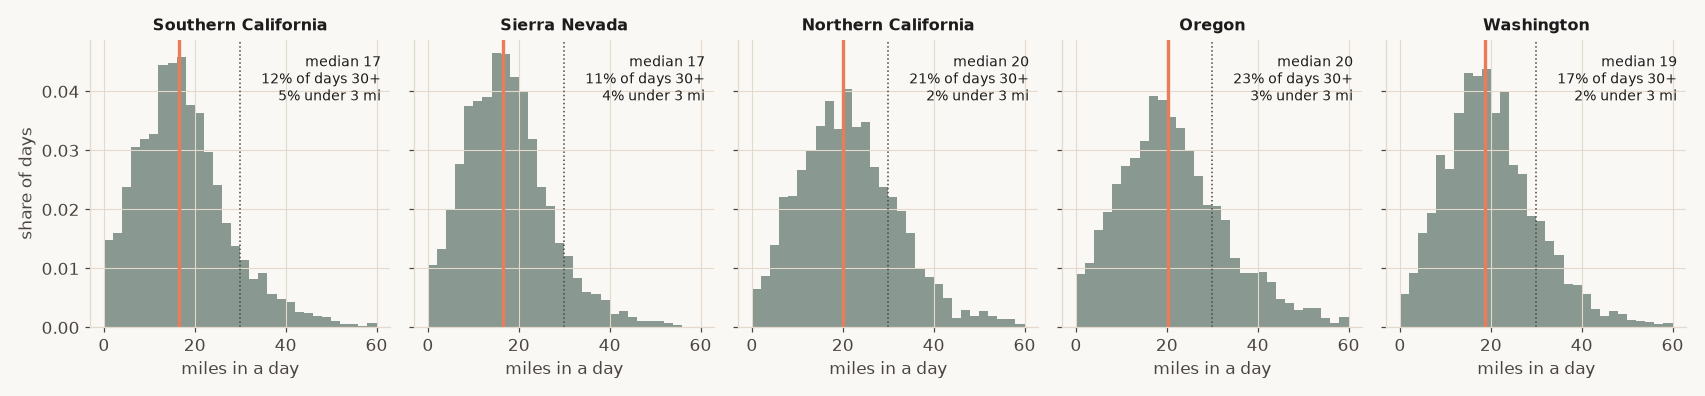
Median Paces by Section for the CDT
| CDT section | Median full day (mpd) | Middle half (mpd) | Mean full day (mpd) | Days of 30+ miles | Days under 3 miles |
|---|---|---|---|---|---|
| CDT, New Mexico (miles 0 to 700) | 19 | 13 to 26 | 20 | 17% | 4% |
| CDT, Colorado (miles 700 to 1,419) | 18 | 12 to 25 | 20 | 14% | 3% |
| CDT, Wyoming (miles 1,419 to 1,929) | 21 | 15 to 29 | 23 | 23% | 2% |
| CDT, Idaho / Montana (miles 1,929 to 2,722) | 21 | 15 to 29 | 23 | 22% | 2% |
| CDT, Glacier region (miles 2,722 to 2,908) | 20 | 13 to 27 | 21 | 19% | 1% |
Median Paces by Section for the PCT
| PCT Section | Median full day (mpd) | Middle half (mpd) | Mean full day (mpd) | Days of 30+ miles | Days under 3 miles |
|---|---|---|---|---|---|
| PCT, Southern California (miles 0 to 700) | 17 | 11 to 24 | 18 | 12% | 5% |
| PCT, Sierra Nevada (miles 700 to 1,300) | 17 | 11 to 23 | 18 | 11% | 4% |
| PCT, Northern California (miles 1,300 to 1,691) | 20 | 14 to 28 | 22 | 21% | 2% |
| PCT, Oregon (miles 1,691 to 2,206) | 20 | 14 to 29 | 22 | 23% | 3% |
| PCT, Washington (miles 2,206 to 2,652) | 19 | 13 to 26 | 20 | 17% | 2% |
Northbound-looking people, consecutive-day comment pairs. “Days under 3 miles” are not included in the pace, as they are assumed to be “zeroes”.
The forward march of time (Method B)
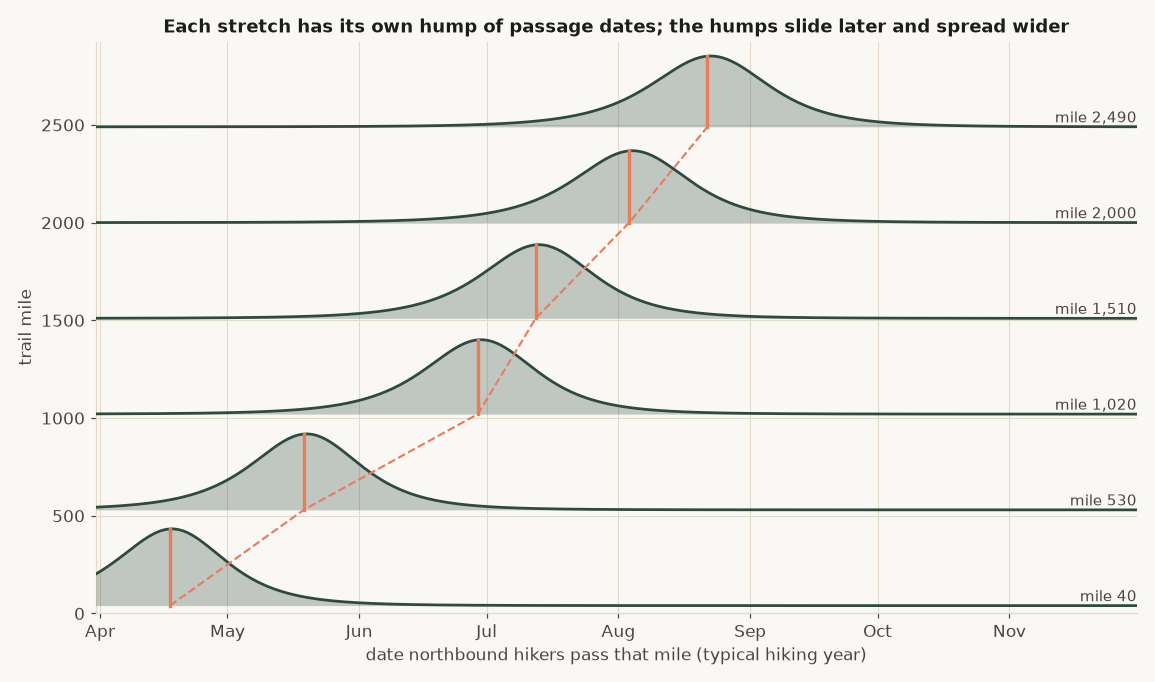
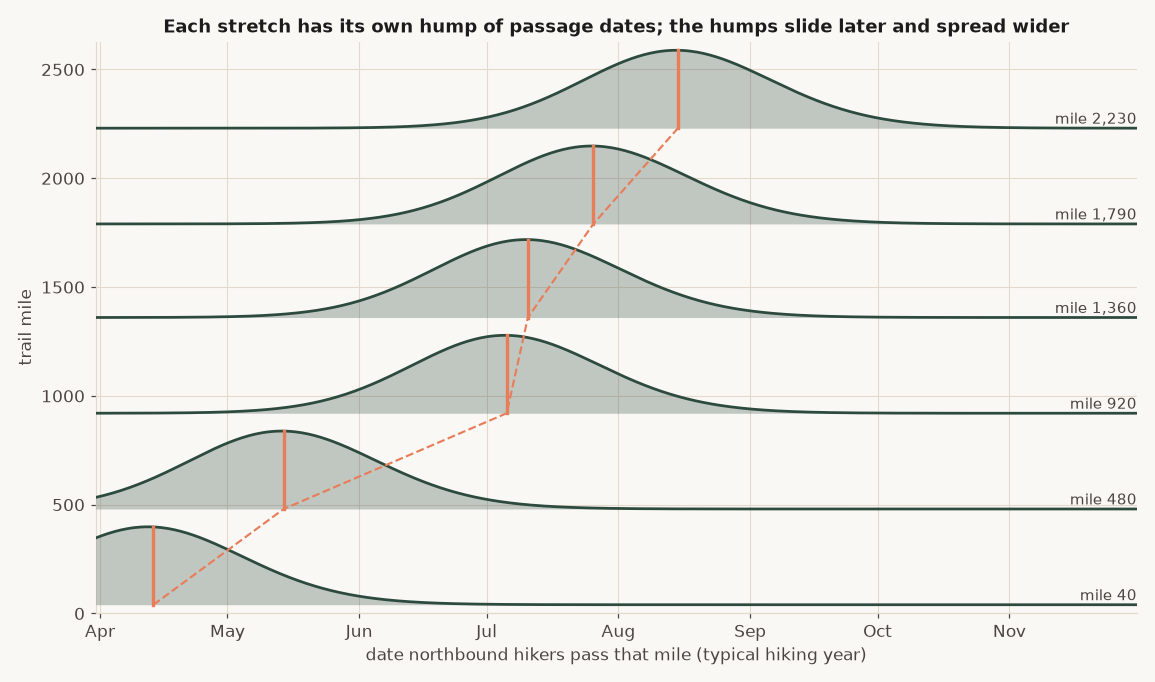
The median from method B is one value representing the entire distribution for a given point on trail. At every segment of trail, the dates people pass make up a probability distribution, where you see a few people come by early, then most people take up a middle set of dates, and then a tail of late people. The picture below is illustrative for a small segment of trail (I did this every 75 miles to define the model I use). As a NOBO hiker hikes northward, the probability distributions slide later into the hiking season, and get wider (the date an early hiker and a late hiker arrive at that section increases). Because people who start on different days also walk at different speeds, you start to see the distribution shift, and the bubble become less pronounced in sections.
Comparing the bubble estimation models
The next series of graphs is fascinating. You’ll see each model detects something slightly different, while still overall agreeing on the general bubble trend. I love looking at the comment density spread in relation to the assumed hiking pace.
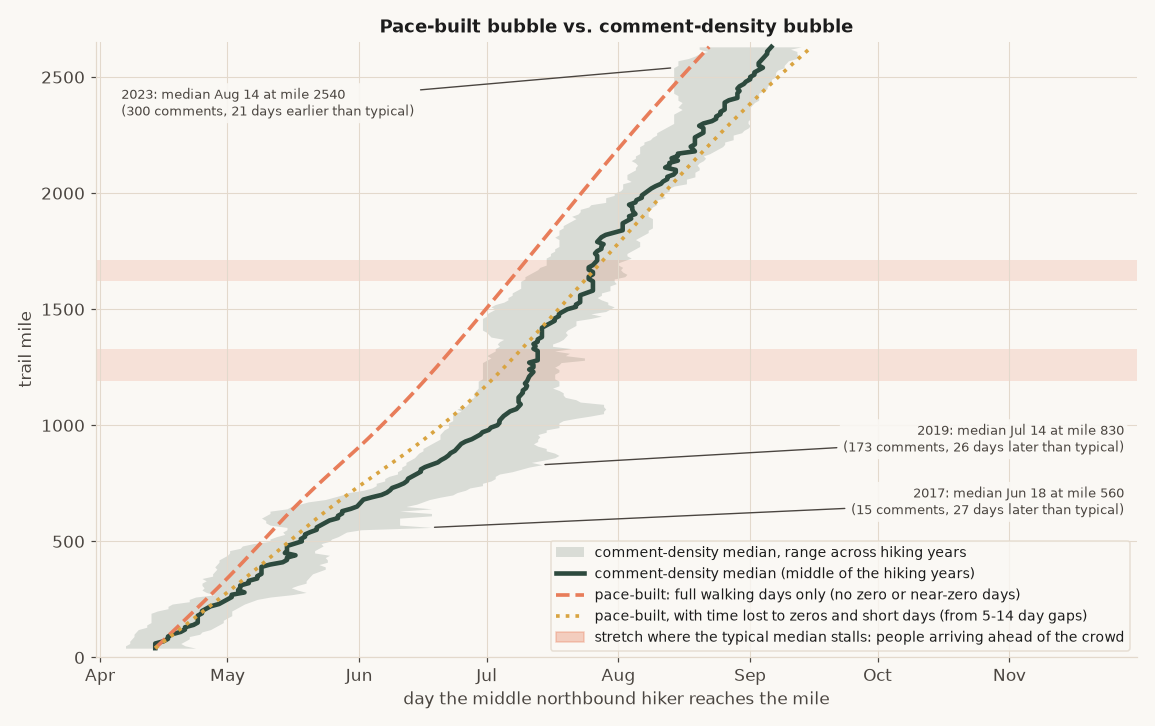
The orange dashed line is based only on comments made on consecutive days. To get a more general “average” hiking pace, you can look at comments made further out. I took comment pairs that were made 5-14 days apart for that boundary, which gives us some sense on the “average” pace including zeroes and nearos for a section. The difference in these paces can also help you estimate the average number of zeroes that get taken in each section (more below).
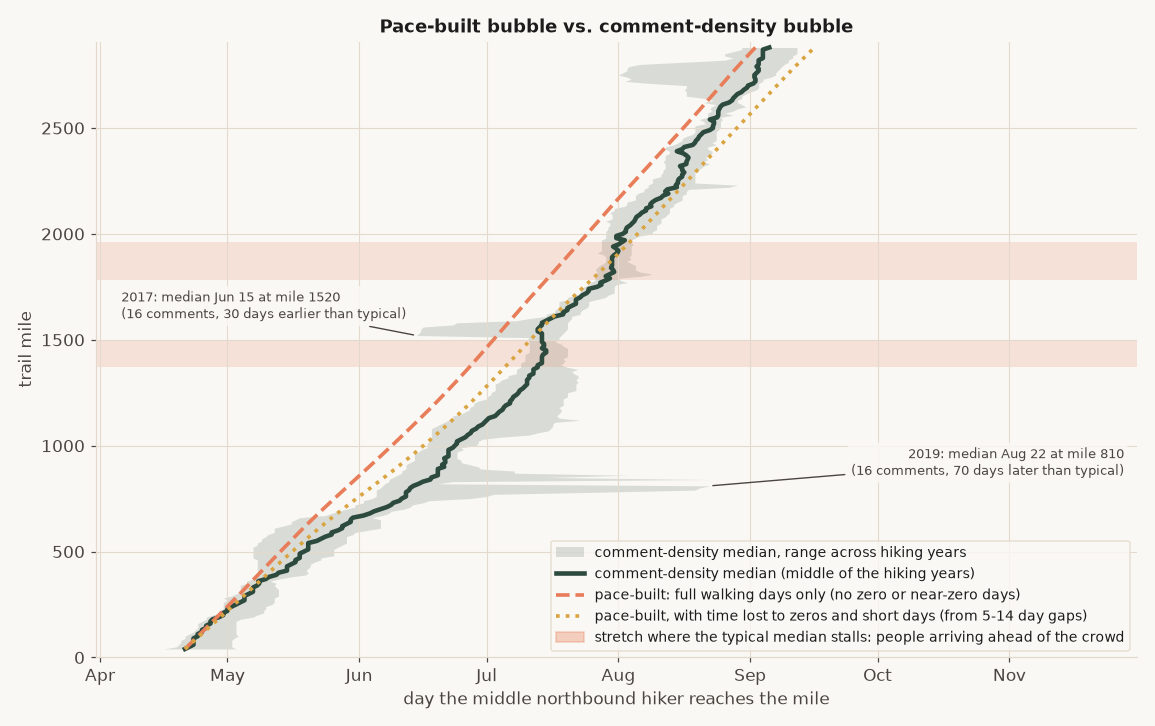
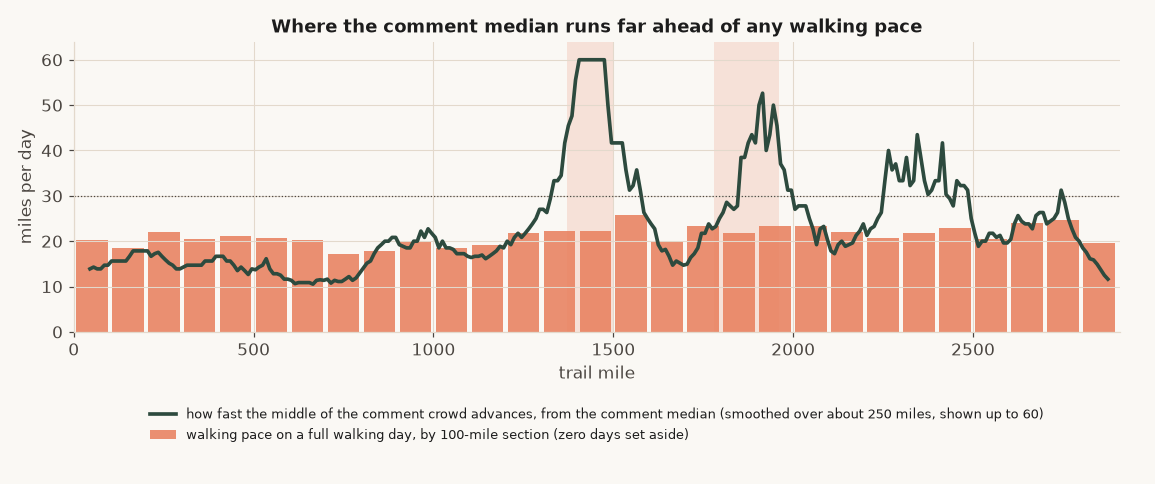
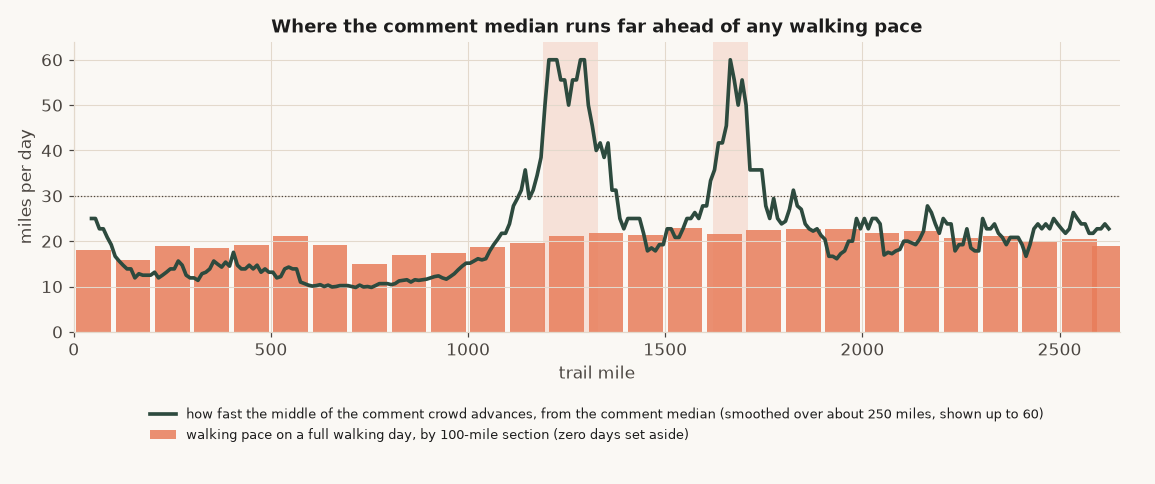
Additionally, you’ll see on the bar chart figure below that the pace suddenly shoots up. This is indicative that people have appeared in that section sooner than expected (for the median from one section to the next to match, you’d have to increase hiking pace to the listed value for that to occur). Because most people are not doing 60 mile days, this is a data indicator that people are skipping up to that section (flipping).
You can also see very clearly in the CDT graph above, that in some years the gray band shifts very early, or very late for hiking comments. This again is indicative of flipping and skipping behavior. We can see that a bunch of folks flip up to the Wyoming Basin early, and also flip up to Glacier early. Then we see the dragged-late gray band near the San Juans, suggesting that people return there.
The PCT behavior is a LOT less clean than the CDT’s. I think the main interpretation from this is that the CDT is just a better trail ;). But really, what we see is that skipping and flipping behavior on the PCT is a lot less straight forward. There’s more skipping to different parts of the trail when it does occur, and just overall wider variability starting with the Sierras.
In terms of comment pace estimation, you can see that the estimated median pace is pretty consistent across the entire trail. The comment density line follows the pacing estimates pretty consistently, except for a few areas. Where the calculated pace (based on comment density) jumps, it indicates that people are showing up there ahead of the crowd they “belong to,” providing empirical evidence for skipping. This means we have a neat, quantitative method to estimate just how much skipping and flipping occurs (more below)!
The table below gives you a sense for when folks are estimated to reach each different section of trail based on the bubble modeling method used. The “walking days only” is the comments on consecutive days model (quicker walking paces), while the “lost days” includes the zeroes and nearos that slow people down.
| Mile | CDT comments | CDT walking days only | CDT with lost days | PCT comments | PCT walking days only | PCT with lost days |
|---|---|---|---|---|---|---|
| 40 | Apr 21 | Apr 21 | Apr 21 | Apr 14 | Apr 14 | Apr 14 |
| 540 | May 20 | May 15 | May 18 | May 20 | May 11 | May 18 |
| 1,040 | Jun 26 | Jun 11 | Jun 18 | Jul 5 | Jun 9 | Jun 23 |
| 1,540 | Jul 13 | Jul 4 | Jul 13 | Jul 23 | Jul 3 | Jul 20 |
| 2,040 | Aug 4 | Jul 26 | Aug 7 | Aug 11 | Jul 25 | Aug 14 |
| 2,540 | Aug 22 | Aug 18 | Aug 31 | Sep 4 | Aug 18 | Sep 10 |
Median northbound hiker. Pace-built lines are anchored at the comment median at mile 40, so they cannot differ there.
The comment median (Method B), for the most part sits between the two pace-built lines (Method A). The PCT has more variability than the CDT, likely because flip-flopping isn’t as straight forward, and skipping, fire closures, and other things may create variability in ways that aren’t addressed in the model
How does snowpack move the bubble?
From my own experience, I assumed that snowpack had a pretty big impact on the bubble. After all, it does affect how hikers enter a section, and what they’re doing in terms of waiting out snow.
I made linear regression models to predict the median entry date for each 100-mile segment of a trail. The model aimed to predict the median entry date for that section based on the median entry date for each of the years I have — 2017 to 2026 (n=9). This was done using the NOBO dates for each section. Rather than fitting the model on all n=9 years, I dropped one year I would try to predict from the regression model, and use all other years + the snowpack indicator for snowpack surrounding that region. Snowpack does seem to improve prediction, slightly, for some sections.
Error in median section prediction with and without snowpack as a predictor
| Trail, stretch | Median-of-other-years error | With snowpack | Days of delay estimate per doubling of snowpack |
|---|---|---|---|
| CDT, mile 1,000 (9 hiking years) | 2.7 | 2.1 (better) | +4.4 |
| CDT, mile 1,100 (8 hiking years) | 6.8 | 5.3 (better) | +10.0 |
| CDT, mile 1,200 (8 hiking years) | 5.9 | 4.4 (better) | +9.5 |
| CDT, mile 1,300 (8 hiking years) | 4.4 | 4.0 (better) | +6.2 |
| CDT, mile 1,400 (9 hiking years) | 2.4 | 2.1 (no gain) | +6.2 |
| PCT, mile 700 (8 hiking years) | 6.5 | 4.7 (better) | +3.7 |
| PCT, mile 800 (8 hiking years) | 8.1 | 6.3 (better) | +3.6 |
| PCT, mile 900 (8 hiking years) | 6.1 | 7.2 (no gain) | +3.5 |
| PCT, mile 1,000 (8 hiking years) | 11.3 | 7.4 (better) | +3.5 |
| PCT, mile 1,100 (8 hiking years) | 6.8 | 5.6 (better) | +3.8 |
| PCT, mile 1,200 (8 hiking years) | 4.9 | 3.9 (better) | +2.2 |
Mean absolute error in days, leave-one-year-out, 8 to 9 hiking years per milepost. The last column is the estimated coefficient for how snowpack is likely to impact the date the bubble gets to a given section.
- Where snowpack prediction seemed to decrease prediction error: CDT miles 1,000 to 1,400 (north-central Colorado: from Salida through the Collegiate Peaks, Grays Peak and Grand Lake toward Steamboat) and PCT miles 700 to 1,200 (the Sierra, Kennedy Meadows to Sierra City). Both are where a snowy spring physically slows or gates the northbound crowd.
- Overall effect: a doubling of April 1 snowpack delays the middle of the northbound crowd by roughly 2 to 4 days on the PCT in the Sierra and 4 to 10 days on the CDT in Colorado.
Everywhere else, on both trails, the snowpack does not improve the model, and actually increases error.
Estimating the flippers and skippers
If you look at people who typically leave comments before a snowy stretch ripe for skipping, and then look at the comments after it, going north, the people not skipping the section (walkers) will usually have written comments inside the snowy section. Someone skipping, on the other hand, will not have any comments in the snowy section.
However, plenty of folks walking a section will also not have bothered writing any comments in that section, even though they went through it. We can see if there’s any sections that are unique, in that folks are more likely to NOT write comments in when expected, compared to the other, non-snowy sections (placebo sections), on trail, to get a decent estimate on flipping and skipping.
a = share with no comment inside the snowed-in area
b = share with no comment inside the placebo stretch

skip-like share  =  (a - b) / (1 - b)
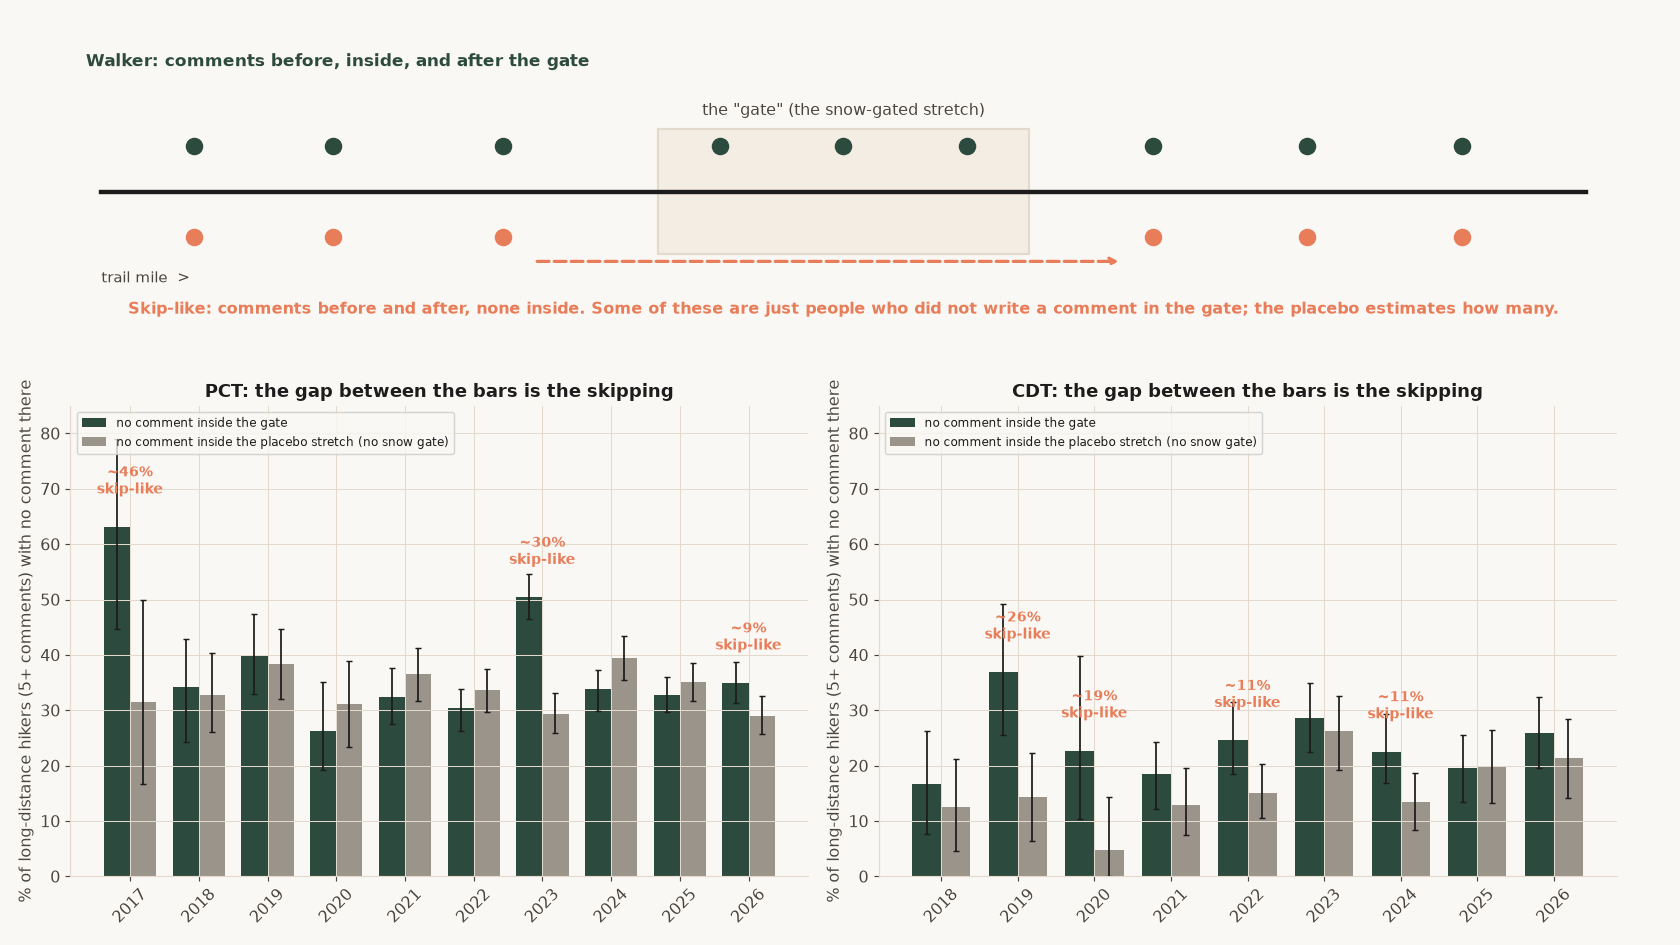
- PCT, 2023: about 30 percent skip-like behavior for the sierra (90 percent interval 23 to 36). That was the record Sierra snow year.
- PCT, other hiking years: the two bars match, so skipping is not distinguishable from zero.
- CDT: is a little bit messier for quantifying skipping and flipping using this approach. This is likely because the CDT has many official alternates, which allows them to regularly deviate from the main trail both in placebo sections, and in the snow-bound sections.
Where do people skip and flip to?
As discussed above, if a hiker skips a stretch, they are likely to appear further up the trail without ever being seen in a downstream stretch, and will be up-trail on a date earlier than would be predicted from walking. So I took everyone seen near a further up-trail mile (mile b), and split them into two groups. Those who also had a comment earlier on trail at mile A, 200 miles back, and those who did not. It’s then possible to see if the people with no earlier-trail comment arrived earlier than the people that did have comments earlier on trail. If everyone was walking at a walking pace, then we would expect the differences in arrival times between these groups to be insignificant.
| Trail, stretch | Kind | Hikers with no comment arriving earlier in the section than hikers with an earlier comment. | Implied early jumpers | Early jumpers as a share of everyone at this mile |
|---|---|---|---|---|
| CDT, mile 1,300 to 1,500 | likely spot to skip to | 27% | 19% | 10% |
| CDT, mile 700 to 900 | placebo | 14% | 4% | 2% |
| CDT, mile 1,600 to 1,800 | placebo | 12% | 2% | 1% |
| CDT, mile 1,900 to 2,100 | placebo | 13% | 3% | 2% |
| CDT, mile 2,400 to 2,600 | placebo | 2% | 0% | 0% |
| PCT, mile 1,150 to 1,350 | likely spot to skip to | 20% | 10% | 6% |
| PCT, mile 1,550 to 1,750 | likely spot to skip to | 19% | 10% | 6% |
| PCT, mile 450 to 650 | placebo | 9% | 0% | 0% |
| PCT, mile 1,750 to 1,950 | placebo | 7% | 0% | 0% |
| PCT, mile 1,950 to 2,150 | placebo | 19% | 10% | 6% |
| PCT, mile 2,150 to 2,350 | placebo | 10% | 0% | 0% |
| PCT, mile 2,350 to 2,550 | placebo | 12% | 2% | 1% |
Hiking years 2018 to 2025 pooled. Based on the “placebo” rows, one might expect 10% of folks to arrive on the early-side of the distribution in a section having not commented in the prior sections. For the spots that are likely to be skipped to, we see early-arrival rates significantly ahead of the placebo spots.
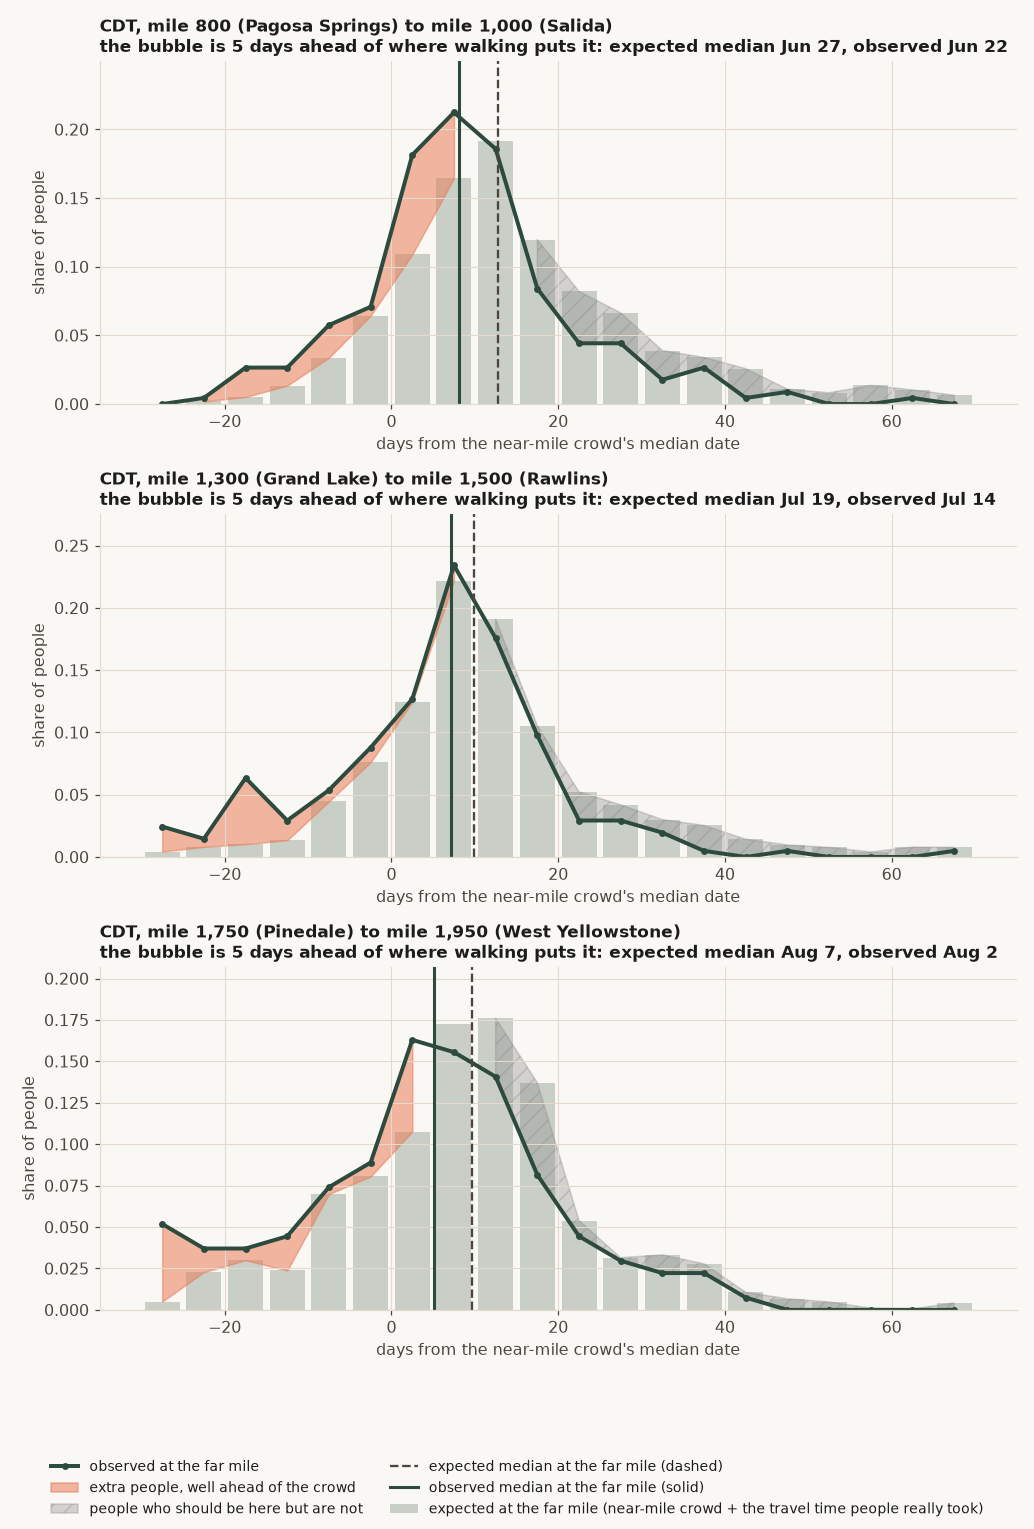
On the CDT for the stretch with the relatively flat median (miles 1,300 to 1,500 that has a larger, flat distribution likely due to skipping and flipping), we see that about 27 percent of folks in that stretch may be considered early arrivals, relative to 2 to 14 percent in the placebo stretches identified. This accounts for about 9 percent of everyone there.
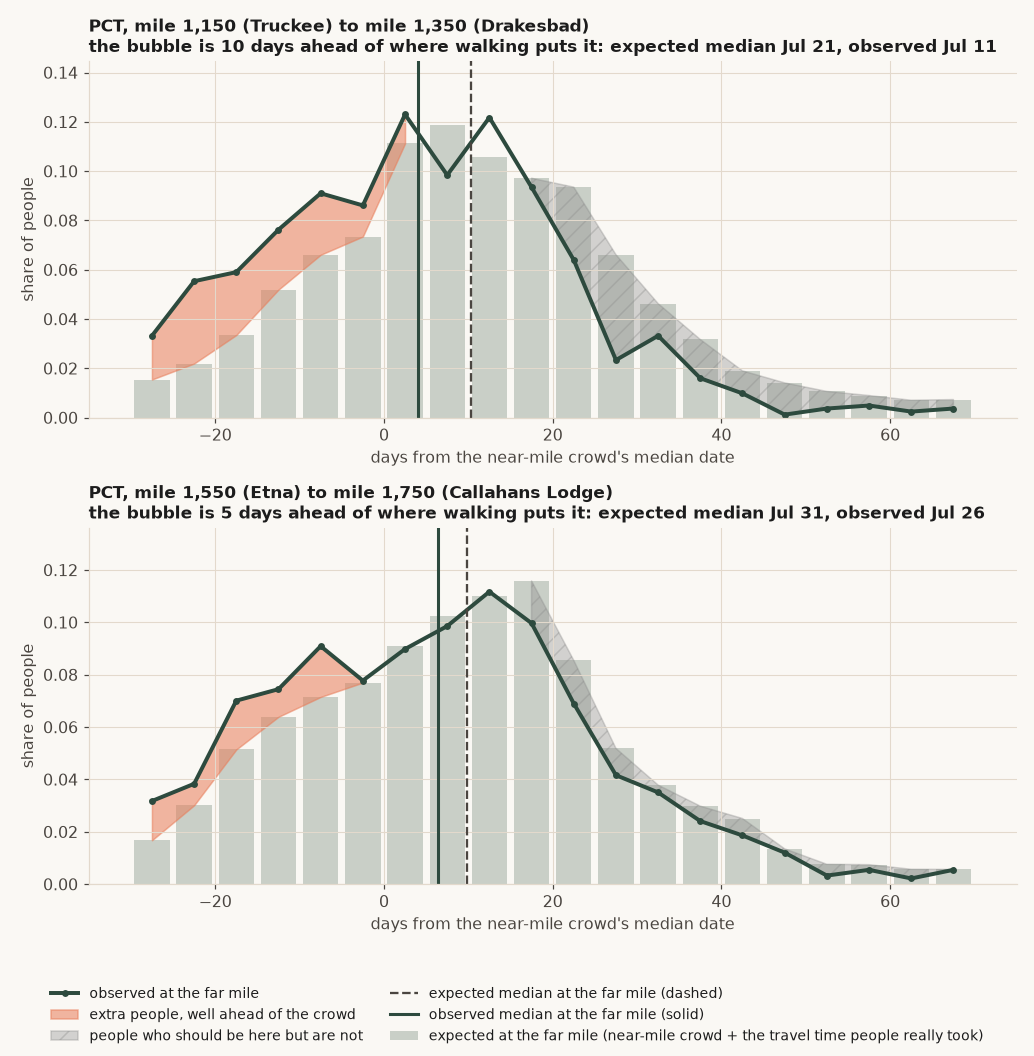
On the PCT the two flat stretches I estimate that about 6 percent of people at that stretch are likely to have jumped ahead. It’s worth noting that one of the placebo stretches I evaluated also estimated about 6 percent of the people there being “jumpers”, so the PCT signal for jumping is much noisier (or it means that more jumping, in general. happens on the PCT).
Visualizing flip-flopping and the bubble
If you take everyone seen near mile A, add to each person’s date the travel time people really took to walk a section (e.g. the people seen at both ends took about 10 days for 200 miles), this would give you a probability distribution for where folks are expected to be in relation to mile b, further along the trail. We can compare the expected probability distribution to the actual distribution to highlight who’s there ahead of schedule, relative to what would otherwise be expected.
Counting the number of flippers and skippers
To estimate the number of total people skipping around I multiplied the “percent anomaly” — those that seem ahead of schedule relative to the expected distribution — by the number of northbound thru-hike attempts expected to be at mile B .
| Trail, stretch | Median date at the near mile (A) | Median date expected at the far mile (B) | Median date actually seen at B | Days ahead of the expected bubble | Extra people ahead of the crowd (area) | Share needed to cross the median to explain the shift | Rough number of flip-floppers per hiking year |
|---|---|---|---|---|---|---|---|
| CDT, Pagosa Springs to Salida (miles 800 to 1,000) | Jun 14 | Jun 27 | Jun 22 | 5 | 19% | 18% | 50 to 100 |
| CDT, Grand Lake to Rawlins (miles 1,300 to 1,500) | Jul 9 | Jul 19 | Jul 14 | 5 | 13% | 17% | 20 to 90 |
| CDT, Pinedale to West Yellowstone (miles 1,750 to 1,950) | Jul 29 | Aug 7 | Aug 2 | 5 | 16% | 19% | 30 to 80 |
| PCT, Truckee to Drakesbad (miles 1,150 to 1,350) | Jul 10 | Jul 21 | Jul 11 | 10 | 15% | 20% | 190 to 510 |
| PCT, Etna to Callahans Lodge (miles 1,550 to 1,750) | Jul 21 | Jul 31 | Jul 26 | 5 | 7% | 9% | 20 to 210 |
Where else is skipping happening?
I also ran this analysis across every 200-mile stretch of trail at 50-mile increments. When the observed median is at least 4 days ahead of the walking expectation (time it takes to walk from the prior stretch), I identify that as an area with potential skipping. These stretches are identified below.
| Trail, stretch | Largest days ahead of expected bubble | Largest share that must cross the median |
|---|---|---|
| CDT, miles 800 to 1,000 | 5 | 17% |
| CDT, miles 1,350 to 1,550 | 4 | 17% |
| CDT, miles 1,750 to 2,050 | 5 | 18% |
| PCT, miles 800 to 1,000 | 5 | 8% |
| PCT, miles 1,000 to 1,450 | 11 | 21% |
| PCT, miles 1,550 to 1,850 | 5 | 10% |
| PCT, miles 2,050 to 2,250 | 4 | 7% |
Hiking years 2018 to 2025
On the PCT there is indication of skipping ahead to mile 1,000 to mile 1,450, with the peak at 1,050 to 1,250 (about 11 days ahead). On the CDT there are three stretches that seem to be good indicators for where folks skip to: miles 800 to 1,000 (Pagosa Springs to Salida), 1,350 to 1,550 (Grand Lake to Rawlins), and 1,750 to 2,050 (Pinedale to Yellowstone).
Zeroes, long pauses, and people who disappear from trail
Method A estimates the mileage a person travels for a day that they’re walking. However, you can also measure the “average” pace a person is travelling over a longer period of time. The difference between the pace the person travels on days that they walk, and the pace that person travels on average over a longer period of time will tell you how often a person is not walking (when they’re taking zeroes)!
What is measured. Two speeds, both taken from pairs of comments written by the same northbound-looking person in the same year.
- Full-day miles: the median miles between two comments written on consecutive days. This is how far someone goes on a day they walk.
- Net miles per day: the median of (miles between two comments) / (days between them), for pairs 5 to 14 days apart. Whatever happened in between counts: zero days, short days, resupply, waiting out weather.
If the net mileage is lower than full-day miles, the difference is time not spent walking a full day:
effective zero-day share = 1 − (net miles per day) / (full-day miles)
What the number is not. 14 percent does not mean 14 percent of days are zero days. It means the crowd covers 14 percent fewer miles per calendar day than its full-day pace, and that gap bundles zeroes, nearos and half days together. But for our purposes, it’s a decent estimate of zeroes!
Reading the share. “Share of walking time lost” is the fraction of full-walking-day mileage that does not show up per calendar day. Its reciprocal is how often a full day is lost: 10 percent is one full day every 10 days, and a section that takes about 30 days to cover loses about 3 of them (3 zeroes). That conversion counts a half day as half. The range next to it is a 90 percent interval from redoing the calculation on 100 random re-draws of the people (a person’s whole hiking year moves together): the share would land inside it nine times in ten if I had a different random group of hikers.
Estimating Zeroes for the CDT by Section
| CDT section | Miles on a day someone walks (typical) | Comment pairs behind that (written 1 day apart) | Miles per calendar day, zeros and short days included (typical) | Comment pairs behind that (written 5 to 14 days apart) | Share of walking time lost | Plausible range for that share | Same thing as: one full day lost | Full days lost per 500 miles |
|---|---|---|---|---|---|---|---|---|
| CDT, miles 0 to 500 | 19 | 2,124 | 17 | 1,211 | 10% | 8% to 13% | every 10 days | 3.0 |
| CDT, miles 500 to 1,000 | 18 | 1,737 | 15 | 773 | 18% | 14% to 20% | every 5 days | 6.1 |
| CDT, miles 1,000 to 1,500 | 19 | 1,388 | 19 | 660 | 1% | 0% to 4% | about none | 0.2 |
| CDT, miles 1,500 to 2,000 | 22 | 1,351 | 18 | 570 | 16% | 14% to 20% | every 6 days | 4.6 |
| CDT, miles 2,000 to 2,500 | 21 | 1,107 | 21 | 339 | 0% | 0% to 5% | about none | 0.1 |
| CDT, miles 2,500 to 3,000 | 20 | 883 | 18 | 297 | 8% | 3% to 12% | every 12 days | 2.3 |
| PCT section | Miles on a day someone walks (typical) | Comment pairs behind that (written 1 day apart) | Miles per calendar day, zeros and short days included (typical) | Comment pairs behind that (written 5 to 14 days apart) | Share of walking time lost | Plausible range for that share | Same thing as: one full day lost | Full days lost per 500 miles |
|---|---|---|---|---|---|---|---|---|
| PCT, miles 0 to 500 | 17 | 4,137 | 14 | 4,659 | 19% | 18% to 22% | every 5 days | 7.1 |
| PCT, miles 500 to 1,000 | 16 | 3,565 | 12 | 2,921 | 24% | 23% to 26% | every 4 days | 10.0 |
| PCT, miles 1,000 to 1,500 | 20 | 4,532 | 18 | 2,537 | 9% | 6% to 10% | every 11 days | 2.4 |
| PCT, miles 1,500 to 2,000 | 21 | 3,725 | 19 | 2,417 | 9% | 6% to 11% | every 11 days | 2.3 |
| PCT, miles 2,000 to 2,500 | 20 | 4,031 | 17 | 2,107 | 12% | 10% to 14% | every 8 days | 3.5 |
| PCT, miles 2,500 to 3,000 | 18 | 832 | 15 | 108 | 20% | 14% to 25% | every 5 days | 6.6 |
Northbound-looking people, hiking years 2017 to 2025. The comment-pair columns are the number of pairs each speed rests on. “Plausible range” is a 90 percent interval from resampling people: the middle 90 percent of the shares I got when I redid the calculation 100 times on random re-draws of the hikers.
Estimating illness and injuries on trail (pauses and exits)
We can use the comment record to estimate when someone stops hiking. We can do this by looking at the hikers that write comments regularly, and then (a) stopped commenting for a long time, with their next comment being near the same trail mile, and (b) never wrote again.
The first step is to determine the set of hikers that are doing frequent commenting, and then to identify those frequent commenters that fall into either group. These are folks that exited or paused on the trail, which is a decent indication of possible illness or injury.
- Exit: the last comment is more than 60 miles from the end of the trail, and not in the last two weeks of the data. It can be an injury, illness, family emergency, running out of money or time, quitting, a phone that died, or someone who simply stopped writing.
- Pause: a gap of at least ten days (and at least four times the person’s usual gap) with less than 15 miles of progress, after which they write again.
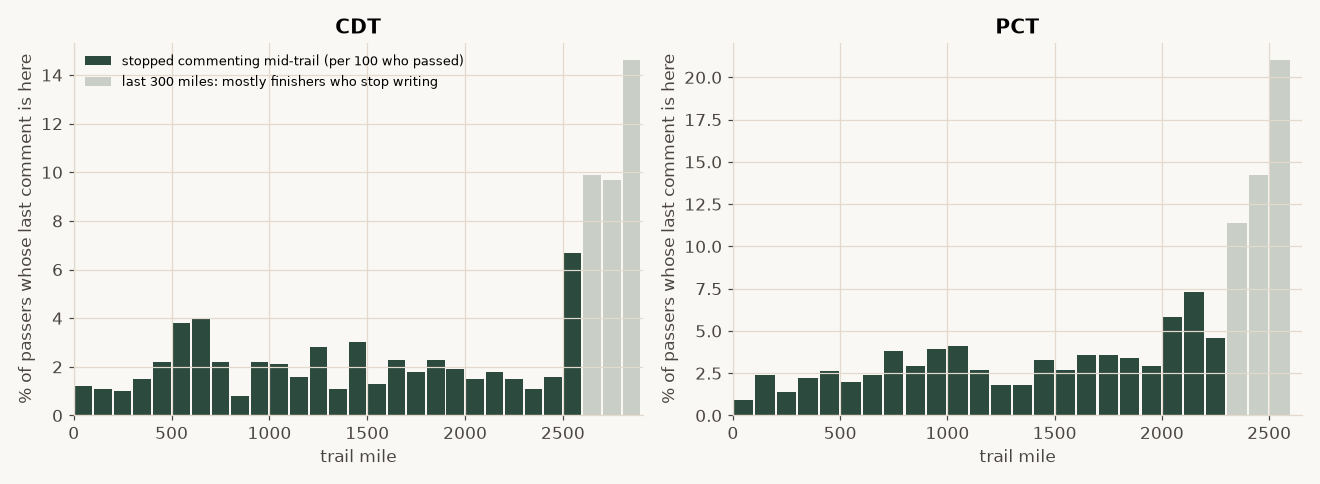
This helps quantify the people that usually are writing and commenting, but then stop commenting suddenly. It’s not possible to separate injury or illness from other reasons (they decided they hate using their phone for comments). What the data show is that there is a modest rise in “exits” through the physically harder middle stretches of the trails, but otherwise about 2-4% of the remaining cohort will drop every 100-miles or so. This rate is pretty flat, which suggests people leave the trail at a pretty constant, predictable rate. For mathing purposes, you can take the percent remain, and compound it every 100-mile period to estimate the total amount of the original cohort that remain. For the PCT, at a constant 2% dropout rate per 100 miles, we’d have: (1-0.02)^(26.5) = 58.5% remaining. As you’ll see below, I bound this a little bit better.
Estimating dropout count by mile
To estimate the number of people dropping from trail, I look at the commenters themselves, and changes in commenting behaviors. I can bracket the commenting behavior by an upper and a lower bound to estimate “maximum drop rates”. The minimum rate makes the assumption that frequent commenters are not significantly different (or unique) when it comes to injury or reasons to leave the trail compared to the typical hiker on the trail not regularly commenting.
- Lower bound: everyone who commented near the start. This population is established by creating a cohort for the northbound-looking people with a comment in the first 60 miles. If a person has a comment at or beyond a certain mile, that person is still considered to be “on trail” and hiking. Someone who never comments again is considered to have left the trail. As such, this bound overestimates attrition.
- Upper bound: based on frequent commenters. This cohort consists of people with at least six comment-days and a typical gap of four days or less between comments across the trail. If one of these “frequent commenters” goes quiet, it implies something changed. This is likely to be indicative of an actual attrition event. Because hikers in this cohort had to be hiking long enough to write six times with gaps of 4 days or less between those comments, this is a conservative estimate of attrition. As such, this metric underestimates the number of people leaving the trail.
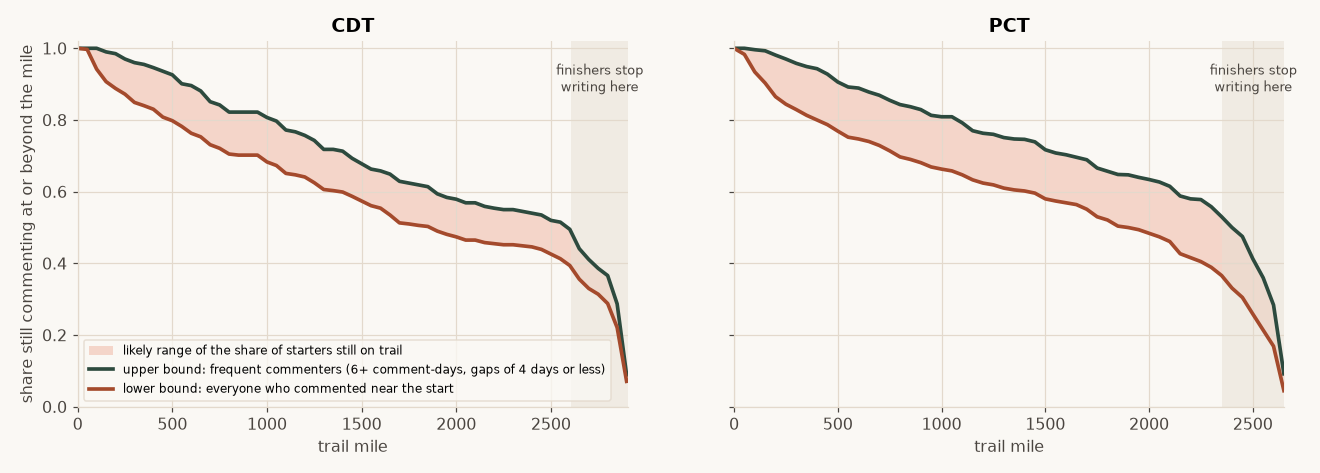
As you’ll see in the data, there is a sudden, sharp drop in survivorship in the last 300 miles. This is an artifact of how the modeling works and the likelihood of hikers commenting.
People do not write in every stretch of trail. Folks that are regularly commenting are only likely to leave a comment about 40 to 70 percent of the time in a 100 mile stretch. So someone that finishes the trail has only about a 50 percent chance of a comment in the last 100 miles, about 75 percent in the last 200, and about 87 percent in the last 300 miles. To estimate the survivorship, I look at the comments in future sections of trail, and if there’s comments there, you’re considered to still be on the trail. Because the trail ends, and there aren’t future sections, the survivorship estimate for the end of the trail relies on people commenting on a smaller subset of waypoints over limited miles, so reliability becomes poor as remaining trail drops below ~300 miles.
| Trail, mile | Survivor Rate (people that ever commented) | Survivor Rate (frequent commenters) |
|---|---|---|
| CDT, mile 300 | 85% | 96% |
| CDT, mile 500 | 80% | 93% |
| CDT, mile 1,000 | 68% | 81% |
| CDT, mile 1,500 | 57% | 68% |
| CDT, mile 2,000 | 47% | 58% |
| CDT, mile 2,400 | 45% | 56% |
| PCT, mile 300 | 83% | 96% |
| PCT, mile 500 | 77% | 91% |
| PCT, mile 1,000 | 66% | 81% |
| PCT, mile 1,500 | 58% | 72% |
| PCT, mile 2,000 | 48% | 64% |
| PCT, mile 2,400 | 33% | 57% |
Share of starters still on trail at each mile. The ahead-and-behind estimator in the tool uses the corrected lower and upper bounds.
It’s good to note that the data suggest that people leave trail more in the first few hundred miles, and then fewer people in total drop further along the trail.
Estimating the number of CDT Hikers
The PCT Association publishes how many long-distance permits it issues, and how many people self-report as having finished the trail. The CDT has no permit system, so it’s possibly harder to track the number of hikers on the CDT.
Estimating CDT Hiking Numbers from Comment Occurrence
It’s possible to estimate the number of hikers by looking at the number of people clearly seen in two different spots on trail. We can estimate this by sampling the number of hikers that appear in one spot of trail, to seeing if the same hiker appears in a different part of the trail. This gives us a “clear thru-hiker” count based on comments.
people commenting in stretch A          = nA
people commenting in stretch B          = nB
people commenting in both A and B       = m

estimated hikers who passed both  ≈  (nA × nB) / m
I use two stretches at least 550 miles apart, so only long-distance hikers pass both. Because the method counts how often the same person shows up in each segment, it automatically adjusts for more commenting in general on one trail compared to the other. This counting approach does not need CDT hikers to comment at the same rate as PCT hikers.A simpler span-based count does.
Estimating CDT hikers by making trail comment rates comparable
- Same hiking year, same windows. The share of PCT permit holders who appear in the data has grown severalfold since 2017 as more hikers use the app to comment on the trail. As such, it’s important to compare trails within a given year, not across given years to account for app use rate
- Commenting rates. From the data, it appears that CDT hikers write more comments per person than PCT hikers. Relying solely on the comment rate, therefore, which would inflate a CDT count. To adjust for this, I drop comments at random from each CDT hiker commenting until the overall comment distribution is more comparable to the PCT commenting rate.
- Scaling with real numbers. The ratio of CDT to PCT hiker comment rates can then be multiplied by the PCTA’s published thru-hike permits (northbound plus southbound).
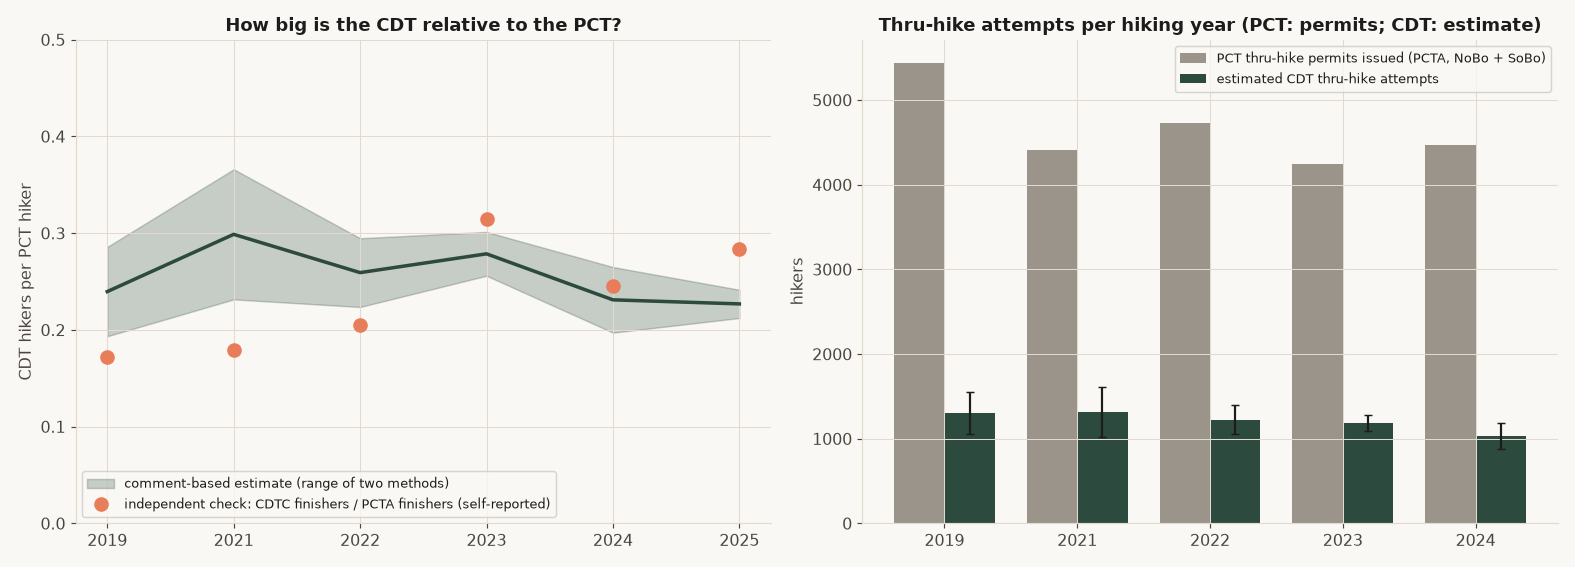
| Hiking year | PCT thru-hike permits (PCTA) | CDT per PCT hiker | Estimated CDT thru-hike attempts |
|---|---|---|---|
| 2019 | 5,441 | 0.19 to 0.29 | 1,050 to 1,560 |
| 2021 | 4,413 | 0.23 to 0.37 | 1,020 to 1,620 |
| 2022 | 4,728 | 0.22 to 0.29 | 1,060 to 1,390 |
| 2023 | 4,247 | 0.26 to 0.30 | 1,090 to 1,280 |
| 2024 | 4,467 | 0.20 to 0.27 | 880 to 1,180 |
PCT figures are from the Pacific Crest Trail Association’s visitor use statistics page. CDT figures are my estimate. Rounded to the nearest 10.
Overall, the PCT appears to have roughly three to five times as many long-distance hikers as the CDT.
Visualizing the bubble in a little tool
The time-lapse on the main bubble page uses the comment density approach (method B above) directly. It draws a moving median of the comments at each stretch, not a fitted model. Generative AI was used to help write most of the code developed to create this front end tool. Data were assembled, cleaned, processed, and verified directly before incorporating them into this tool, and were not generated by an LLM. Results and calculations displayed by this tool are directly calculated using hard-coded methods and a fixed, underlying data set, as discussed and assessed on this page. As such, these results are not subject to hallucination, and remain repeatable. Accuracy of displayed results depends on the reliability and accuracy of the underlying data and methods that were used.
- The line is the median date of direction-labelled comments within 75 miles either side of each mile (the 150 mile stretch from method B), typical across hiking years, lightly smoothed and kept from running backward.
- The shaded band is the middle 80 percent of the comment dates at each mile (their 10th to 90th percentile), measured as the spread of comment dates around each hiking year’s own median and pooled across hiking years. The faint lines are the other hiking years.
- The hiking year menu. A single hiking year is that hiking year’s own moving median, with gaps filled in from the typical year. “Typical hiking year” is the median across hiking years. “This year”, the default, is the typical hiking year shifted by that year’s snowpack in the two stretches where snow improved predictions out of sample, and kept from ever moving backward.
Additional Diagnostics and Discussion
Why the average line can look like it jumps
The line is “the median day people reach this mile.” Where the crowd is a mix of people on very different schedules (walkers who waited for snow to melt, and people who skipped ahead), the median date can barely change over several hundred miles. That makes the line look nearly vertical, as if the crowd covered 500 miles in a week, which basically nobody does. In a single mid-July week the middle 80 percent of northbound comments on the PCT span about 1,000 miles of trail.
Why a gamma distribution to model hiker pace
Speed cannot be negative, and hikers differ by multiples more than by fixed amounts (a 25 mile per day hiker is about 1.5 times a 17 mile per day one). That points to a skewed, always-positive curve. I first reached for the lognormal because it is the common choice. Being bounded by zero is not what picks it, though, since several curves are. I tested three on the one-day moves, fitting each to moves between 2 and 70 miles:
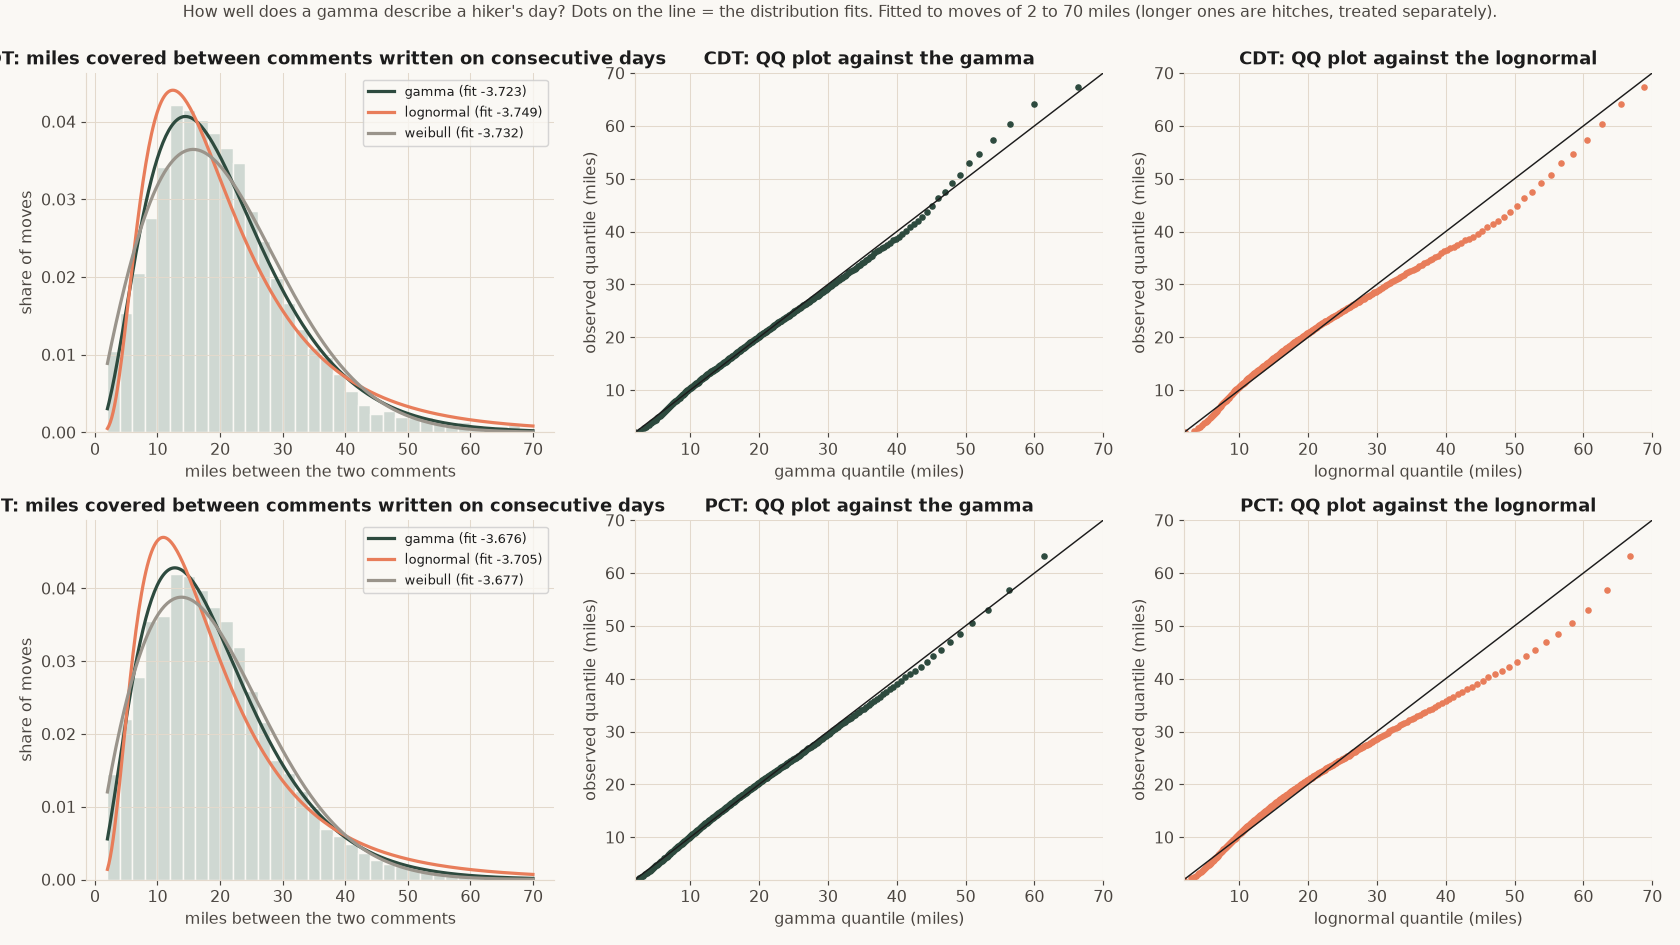
The gamma wins on both trails. In practice it matters at the edge: the lognormal says more people do enormous days than actually do, and the edge is exactly where I decide whether someone hiked or hitched. Weibull is close behind. All three are fitted to the same truncated range so no curve gets credit for the part I threw out.